Quiz 2.4:
Question:
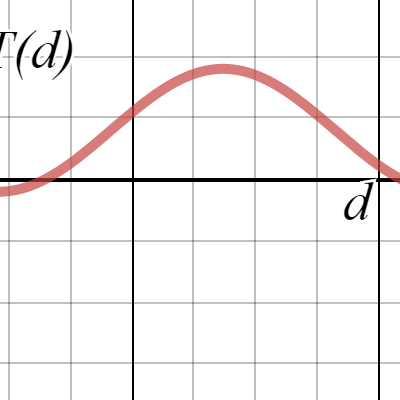
Let \( T(d) \) be the average temperature Fahrenheit in Kansas City on the \(d\)th day of the year. (i.e. \(d=1\) means January 1st)
a) Sketch a graph of \( T(d) \). Be sure to clearly label your axes. Assume that \( d \) is a continuous variables.
b) Explain how and why the values \(T(d)\) and \(T(d+365) \) are related?
b) Explain how and why the values \(T(d)\) and \(T(d+365) \) are related?
Solution:
a)
b) The values \( T(d) \) and \( T(d+365) \) should be equal because they are the same day, just 1 year apart. Note that \( T(d+365) \) is 1 year later.
b) The values \( T(d) \) and \( T(d+365) \) should be equal because they are the same day, just 1 year apart. Note that \( T(d+365) \) is 1 year later.